
Engineering, in the open
How we load-test a ledger, and what a payment per second really means
A benchmark number is only as good as its definition. Here is exactly how we drive load against the ledger, what one transaction per second counts, and why the method maps to real production traffic rather than a lab trick.
We have published three results in this series: that the ledger stays correct at scale, that it fails safely under overload, and that its remaining limit is ordinary compute, not the ledger. Each one quotes a rate in payments per second.
A rate like that is only as trustworthy as its definition. “10,000 requests per second” can mean almost anything if the requests are cheap reads, if half of them failed, or if the number is a peak that lasted two seconds. So this post is the companion to the results: exactly what we count, how we drive the load, and why the method reflects real production traffic instead of a number engineered to look good.
1transaction
= authorize + capture
Two API calls that commit one balanced ledger transaction. Not a raw request, not a read.
100%
delivery, or we do not claim it
We quote the highest rate at which every offered payment completed within budget.
0
tolerance for wrong books
Correctness is audited from raw records after every run, independent of the software's own bookkeeping.
What one transaction per second actually counts
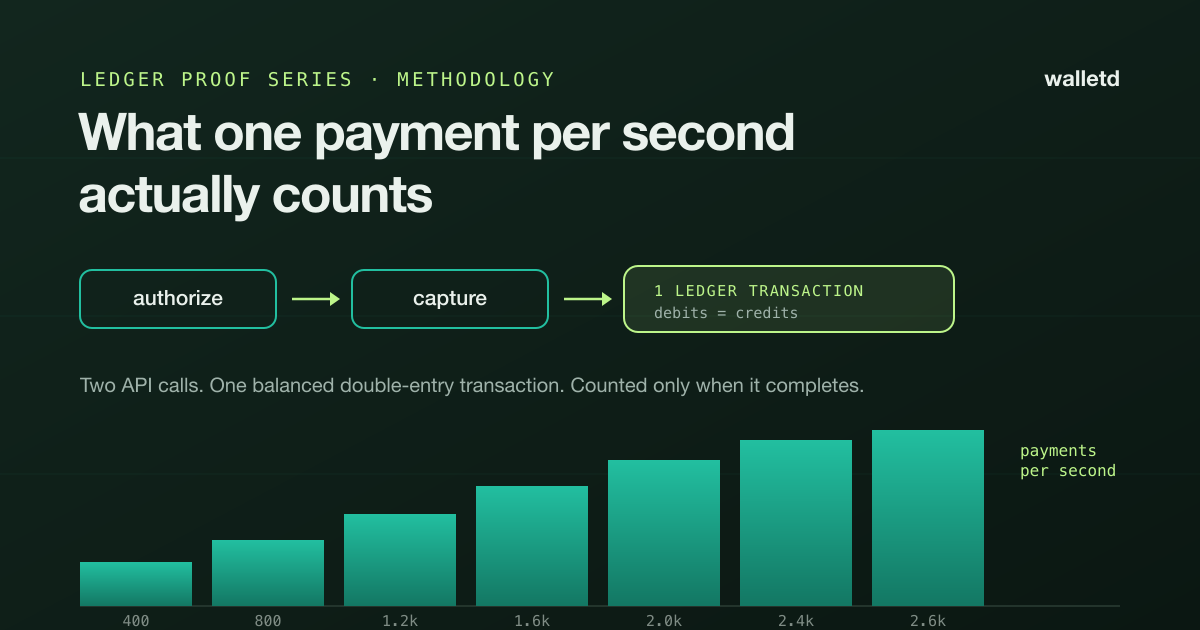
When we say the system sustained a rate of payments per second, one “payment” is a full authorize-and-capture cycle: a request that reserves funds, then a second request that captures them. That cycle is what commits a single ledger transaction, and that transaction writes a set of balanced double-entry postings — every debit matched by an equal credit, money moving from one account to another and never appearing from nowhere.
That choice matters, because it is the conservative one:
- It is not a raw HTTP request. Each counted transaction is two sequential requests, so the request rate on the wire is roughly double the transaction rate we report.
- It is not a read. Balance lookups and history queries are cheap and cacheable; we do not pad the number with them. Every counted transaction moves money and writes to the durable ledger.
- It is the heavy path. Authorize-and-capture does more work than a single-shot payment, so the number reflects the expensive case, not the easy one.
And we count completed transactions, not offered load. If we aim traffic at the system faster than it can finish the work, the offered rate keeps rising but the delivered rate is what we report. Goodput, not attempts.
How we drive the load
A single number hides more than it shows, so we never quote one. We drive a ladder of plateaus — a fixed arrival rate held steady for a plateau, then a step up, then another — and we read each plateau on its own. Holding a rate steady lets a latency percentile settle instead of being smeared across a ramp, which is the most common way a benchmark quietly misleads: quoting a p95 averaged over a rising curve tells you nothing about any real operating point.
Five things keep the ladder honest.
The load generator is never the bottleneck. A load test that runs out of its own capacity looks exactly like a service that stopped keeping up. We run the generator inside the same network as the system (so a laptop’s round-trip time is not in the measurement), size its worker pool to the load it actually needs to offer, and widen its own connection limits so it can hold tens of thousands of concurrent requests. When we could not offer the load, we label the plateau as a client limit and do not report it as capacity.
Every run starts clean and warm. A cold managed database or a database left full of a previous run’s half-finished work both distort the first readings. Each run resets to a clean ledger, and a warm-up stage runs before the measured plateaus so we are timing steady-state behavior, not start-up.
Traffic spreads the way real traffic does. Load lands across many accounts and many merchants, not one hot row. A benchmark that hammers a single account measures lock contention on that account; a real system’s load is spread, and so is ours.
Correctness is measured two ways. During the run, the generator watches the invariants live. After the run, a separate audit recomputes every balance directly from the raw transaction records — without trusting the software’s own running totals — and checks the same invariants again. Both have to be clean.
Failures are classified, not lumped together. This is the distinction most benchmarks skip. A 429 or a retryable busy, try again shortly is the system correctly protecting itself; a 5xx or a timeout is a real failure. Folding the first kind into an error rate makes a healthy, self-protecting system look broken. We separate them, and only the real failures count against a result.
Conservation
The signed sum of every entry, per currency, is zero. Money is neither created nor destroyed.
Every transaction balances
No single transaction leaves the books uneven.
Stored equals recomputed
Every account balance matches the sum of its own history. Nothing drifted.
No prohibited overdrafts
No account holds a balance its configured rules forbid.
What “delivered” means, precisely
We report the highest plateau at which every offered payment completed inside an acceptable latency budget, with zero real failures and zero ledger violations. Above that, a system does one of two things, and we say which:
- It refuses — answering quickly with a retryable busy signal and shedding the excess. Delivery drops, but nothing breaks and nothing is lost. This is the healthy way to be over capacity.
- It degrades — still committing the work, but with latency climbing past the budget. Also honest, also survivable, just slower.
What we are careful never to call capacity is a plateau the client could not drive. If the load generator ran out of its own headroom, that says nothing about the service, and we throw the number out.
Why the method maps to production
None of this is a lab trick tuned to a benchmark. Every property we test is a property production depends on.
- The money paths are real. Authorize, capture, and the balanced postings behind them are the same code that would move a customer’s money, committed durably, not a mock that returns 200 and forgets.
- The hardest concurrency case is enforced. Accounts spend against an enforced limit, so “two concurrent debits that each pass the check” — the classic way a ledger loses money — is exactly the race the test is exercising, at rate.
- Correctness is held to zero, and proven independently. Across millions of transactions, an audit that recomputes the books from raw records returns zero on every invariant. A ledger that is only correct when it is idle is not a ledger you can trust.
- The result is an operating point with headroom, not a cliff. We report a rate the system sustains comfortably and show what happens beyond it, so the number is one you could plan real capacity against.
- It is reproducible. The raw data and a hash manifest are public, so the numbers are yours to check rather than ours to assert.
A benchmark you cannot reproduce is a marketing claim. A benchmark with its raw data and its failure behavior in the open is evidence.
The honest limits
Three things this is not, stated plainly because leaving them out is how benchmarks mislead:
- It is a synthetic benchmark on staging infrastructure with generated data, not a record of production traffic.
- A measured rate is the top of what we drove, not an absolute ceiling. The headroom above the lines is the point; we do not extrapolate it into a maximum.
- A retryable busy response is not a server failure, and we do not count it as one.
Early access
Become a design partner.
We are working with a small number of teams building wallet and money products on WalletD. If that is you, let's talk. You will get direct access to the people who built it.